ExcelDataViz
Excel Data Visualization - From Data to Value -- Excel is the best interface for working with data - use it to transform data into ...
@exceldataviz subscribers

ExcelDataViz
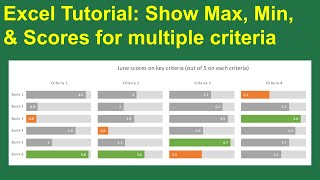
Confusion Matrix - Model performance
5 months ago - 1:06

ExcelDataViz
Same mean. Wildly different shapes. 🐱🐶🐷🐭🐰
9 months ago - 0:38

ExcelDataViz
Same Data, 12 Emotions — Mondrian Meets Machine Learning 🎨
4 months ago - 0:53

Xcelsive English
Excel Data Viz: Highlight Below Average Values with Conditional Formatting 📊 #excel #exceltips
2 years ago - 0:14

Learn Edu Sahil
In-Cell Chart Excel #exceltips #ExcelDataViz #InteractiveCharts #ExcelInCell #DynamicVisualizations
1 year ago - 0:20

DataViz Nations
Excel Tips: How to data arranging Shortcut in Excel - DataViz Nations
1 year ago - 0:43

ExcelDataViz
World Square Map - WGS - Dashboard of the Present Future
3 years ago - 2:12

Data by Jundi
Step Chart in Excel - Quick Tutorial. #Excel #DataViz #StepChart #ExcelTips #Shorts
6 months ago - 0:41

XLGenAI
Negative and positive bar chart in Excel #excel #spreadsheetmagic #microsoftexcel
10 months ago - 0:42

J A EXCEL
#ComboChart #ExcelComboChart #DualAxisChart #ExcelLineAndBarChart #ChartDesign #ExcelDataViz
3 months ago - 2:55

Ann K. Emery
Excel Tables: Biggest time-saver in Excel! #dataviz #pivottables #dashboards
3 months ago - 0:53

BitByBit
Create Auto-Expanding Borders in 30 Seconds ⚡#Excel #DataViz #TechTips #OfficeHacks #bitbybit
10 days ago - 0:41

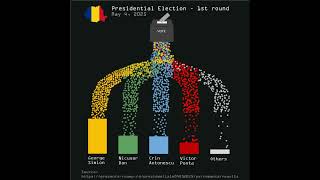
ExcelDataViz
2025 Presidential Election – 2nd round in Romania (May 18,2025)
8 months ago - 0:20

ExcelDataViz
How to create a dynamic "happy face" chart in Excel | Tutorial
1 year ago - 2:11

Excel Maven
Excel Data Viz: The GOOD, the BAD, and the UGLY
9 years ago - 3:45

ExcelDataViz
Vote results - 2024 Presidential Election – Round 1 in Romania
1 year ago - 0:25
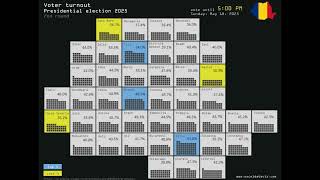
ExcelDataViz
Voter Turnout - 2025 Presidential Election – 2nd round
8 months ago - 0:34

ExcelDataViz
Cycle plot - Monthly sea ice extent, 2010-2021
2 years ago - 0:40

Ann K. Emery
Make Small Multiples Line Charts in Excel #dataviz #charts #spreadsheets
3 months ago - 1:34

Ann K. Emery
Make the Bars Wider -- how?! #Excel #dataviz #HBDXL #GapWidth #charts #graphs
3 months ago - 0:54

ExcelDataViz
Voter turnout - Parliamentary elections - December 01, 2024
1 year ago - 0:26

Formula 4 Fusion
Reverse Vlookup #excelfunction #excelformula #vlookup #googlesheets #excel #exceltips #exceltricks
1 year ago - 0:37

Ann K. Emery
Easy Grouping in Graphs #HBDXL #Excel #dataviz
3 months ago - 1:03